In digital communications, where signals traverse intricate pathways laden with challenges, engineers rely on a powerful visualization tool known as the eye diagram. This graphical representation unveils the mysteries of signal quality, offering profound insights into the integrity and performance of digital transmissions. Through meticulous analysis of voltage against time, the eye diagram exposes the nuances of signal behavior, from the graceful dance of an open eye to the ominous shadows of closure.
In this exploration, we embark on a journey to unravel the significance, components, applications, and profound implications of eye diagrams in the vast landscape of modern communication systems. Join us as we delve into the depths of this invaluable tool, illuminating its role in shaping the future of digital connectivity.
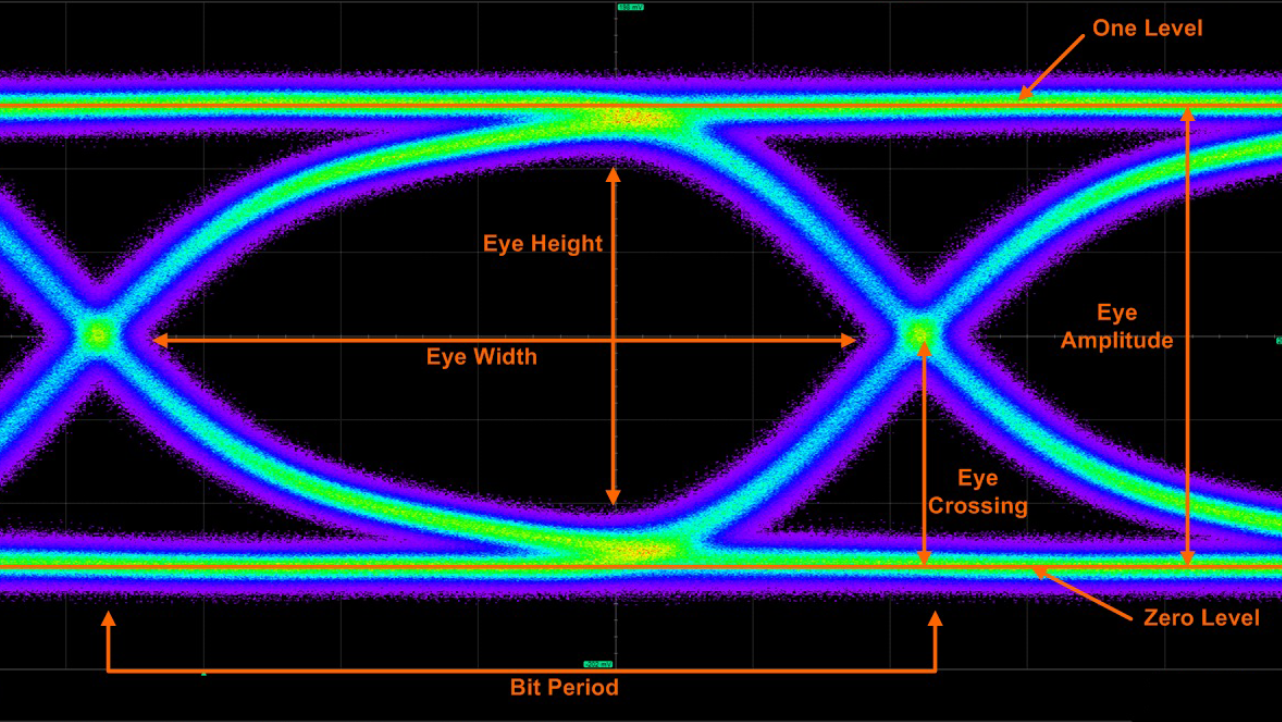
1. What is an Eye Diagram?
An eye diagram is a graphical representation used in digital communications to visualize the quality and integrity of a digital signal. It consists of a plot of voltage (or current) versus time, resembling the shape of an eye, hence the name.
2. Why is it Used?
- Signal Quality Assessment: The primary purpose of an eye diagram is to assess the quality of a digital signal. It provides insights into various aspects of signal integrity, such as amplitude levels, timing jitter, and noise.
- Characterization of Transmission Channel: By analyzing the eye diagram, engineers can characterize the transmission channel, including its attenuation, distortion, and noise characteristics. This helps in designing robust communication systems.
2. Components of an Eye Diagram:
A. Eye Opening:
- The central feature of the eye diagram is the eye opening, which represents the region where the receiver samples the signal.
- A wide and well-defined eye opening indicates good signal integrity, allowing the receiver to accurately detect different signal levels.
B. Eye Closure:
- When the eye opening narrows or closes, it signifies signal distortion or noise, making it challenging for the receiver to distinguish between signal levels.
- Eye closure can result from factors such as intersymbol interference, timing jitter, or amplitude distortion.
C. Sampling Timing:
- The horizontal width of the eye diagram corresponds to the bit period or symbol duration.
- It illustrates the time interval during which the signal is sampled by the receiver.
- Accurate sampling timing is crucial for proper signal detection and recovery.
D. Voltage Levels:
- The vertical height of the eye diagram represents the voltage levels of the signal.
- A larger vertical span indicates a higher voltage swing, which can be affected by factors like signal attenuation, equalization, or amplification.
3. Applications in Industry:
A. Telecommunications:
- Eye diagrams are extensively used in telecommunications for evaluating the performance of communication channels, including optical fiber, coaxial cable, and wireless links.
- They aid in optimizing system parameters such as modulation schemes, equalization techniques, and clock recovery methods.
B. Data Storage:
- In data storage systems such as hard disk drives and solid-state drives, eye diagrams help assess read and write performance.
- They assist in characterizing recording media, read channel electronics, and error correction algorithms.
C. Networking:
- Eye diagrams play a crucial role in networking equipment such as routers, switches, and transceivers.
- They facilitate the design and testing of high-speed serial interfaces, ensuring reliable data transmission over Ethernet, USB, PCIe, and other protocols.
4. Conclusion:
Eye diagrams serve as indispensable tools for engineers and researchers involved in digital communication systems. By providing a visual representation of signal characteristics, they enable thorough analysis, troubleshooting, and optimization of communication links across various industries.